More Books, Better Prices

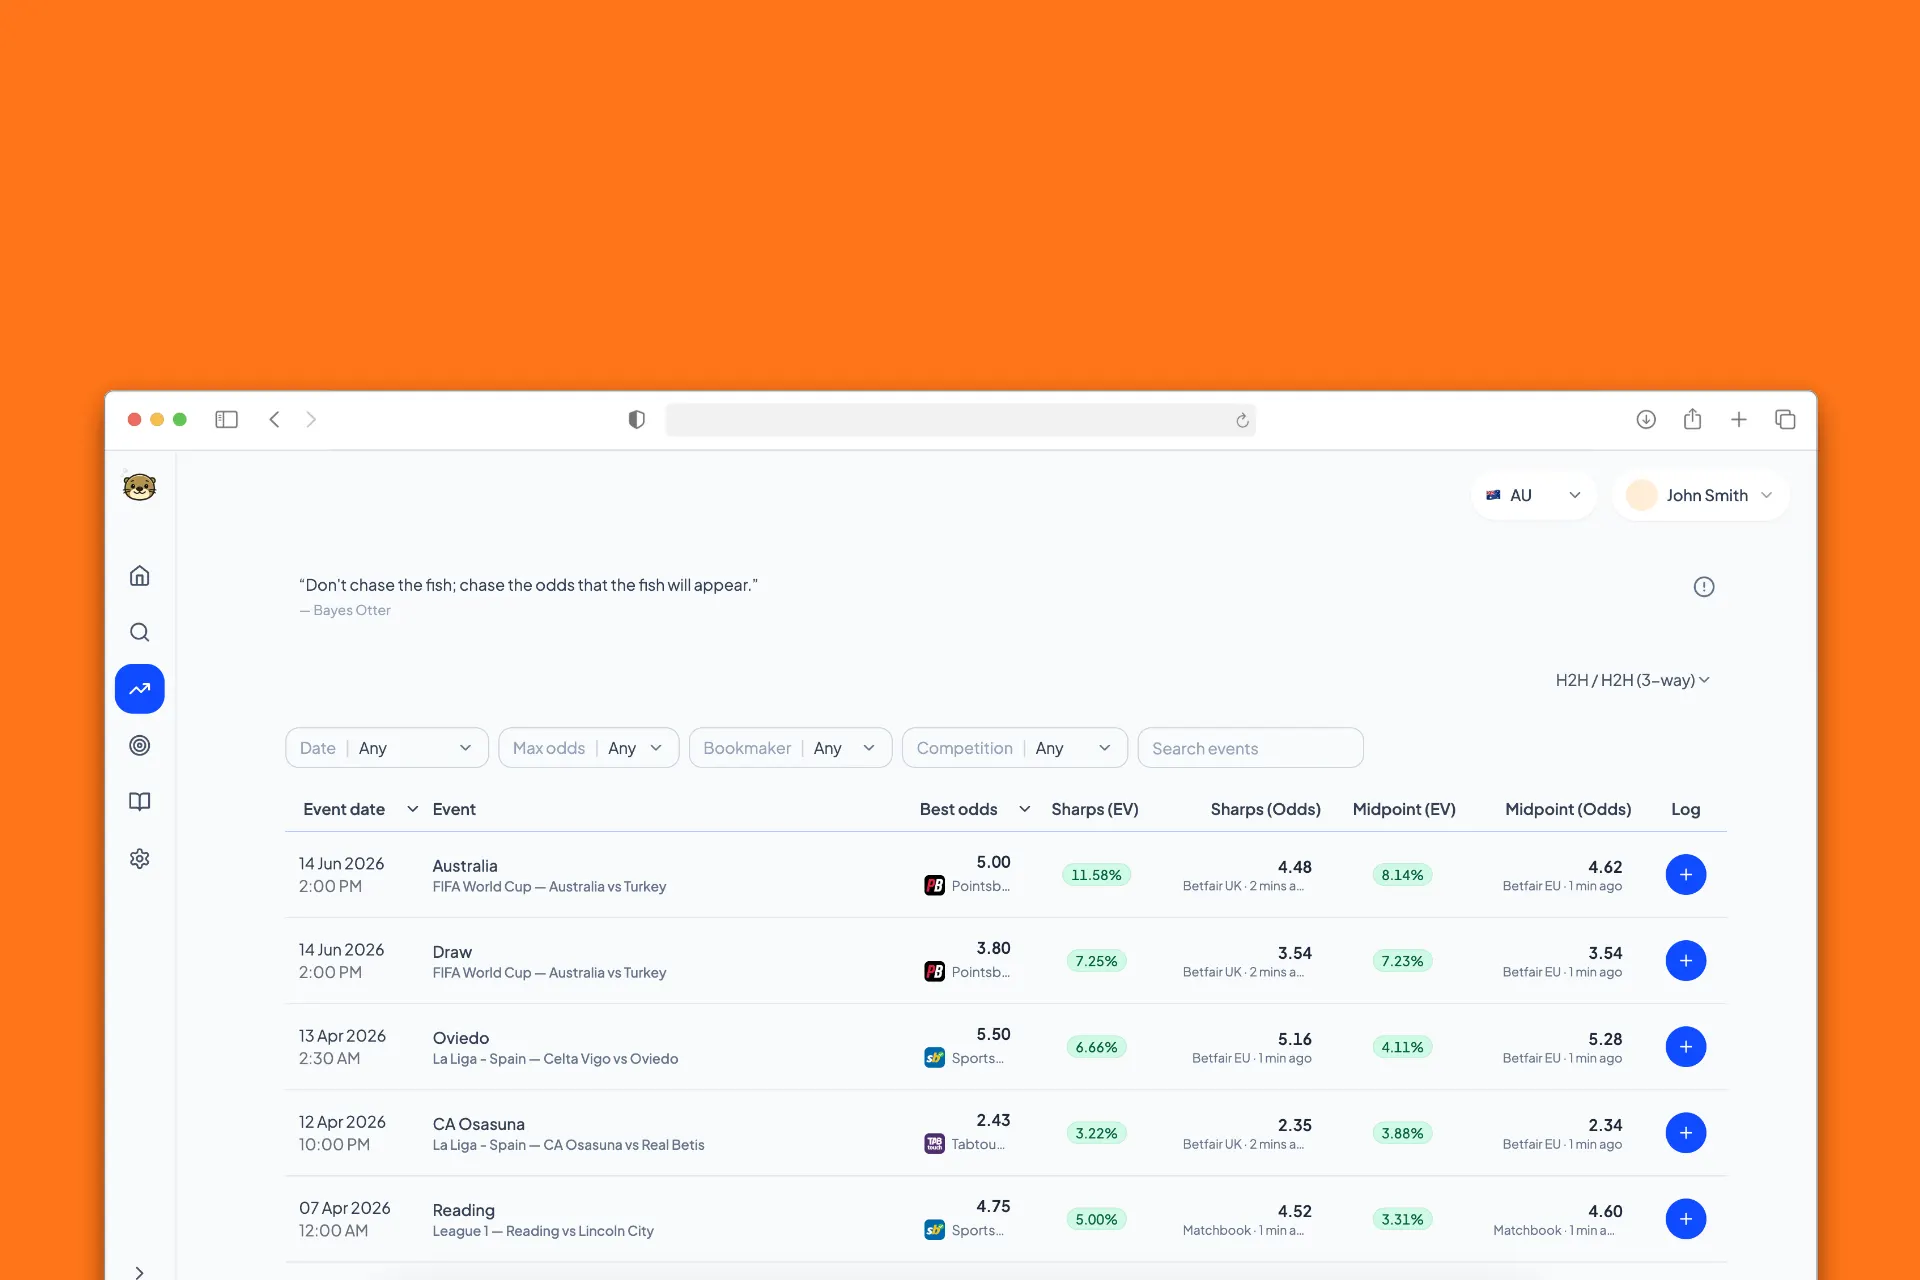
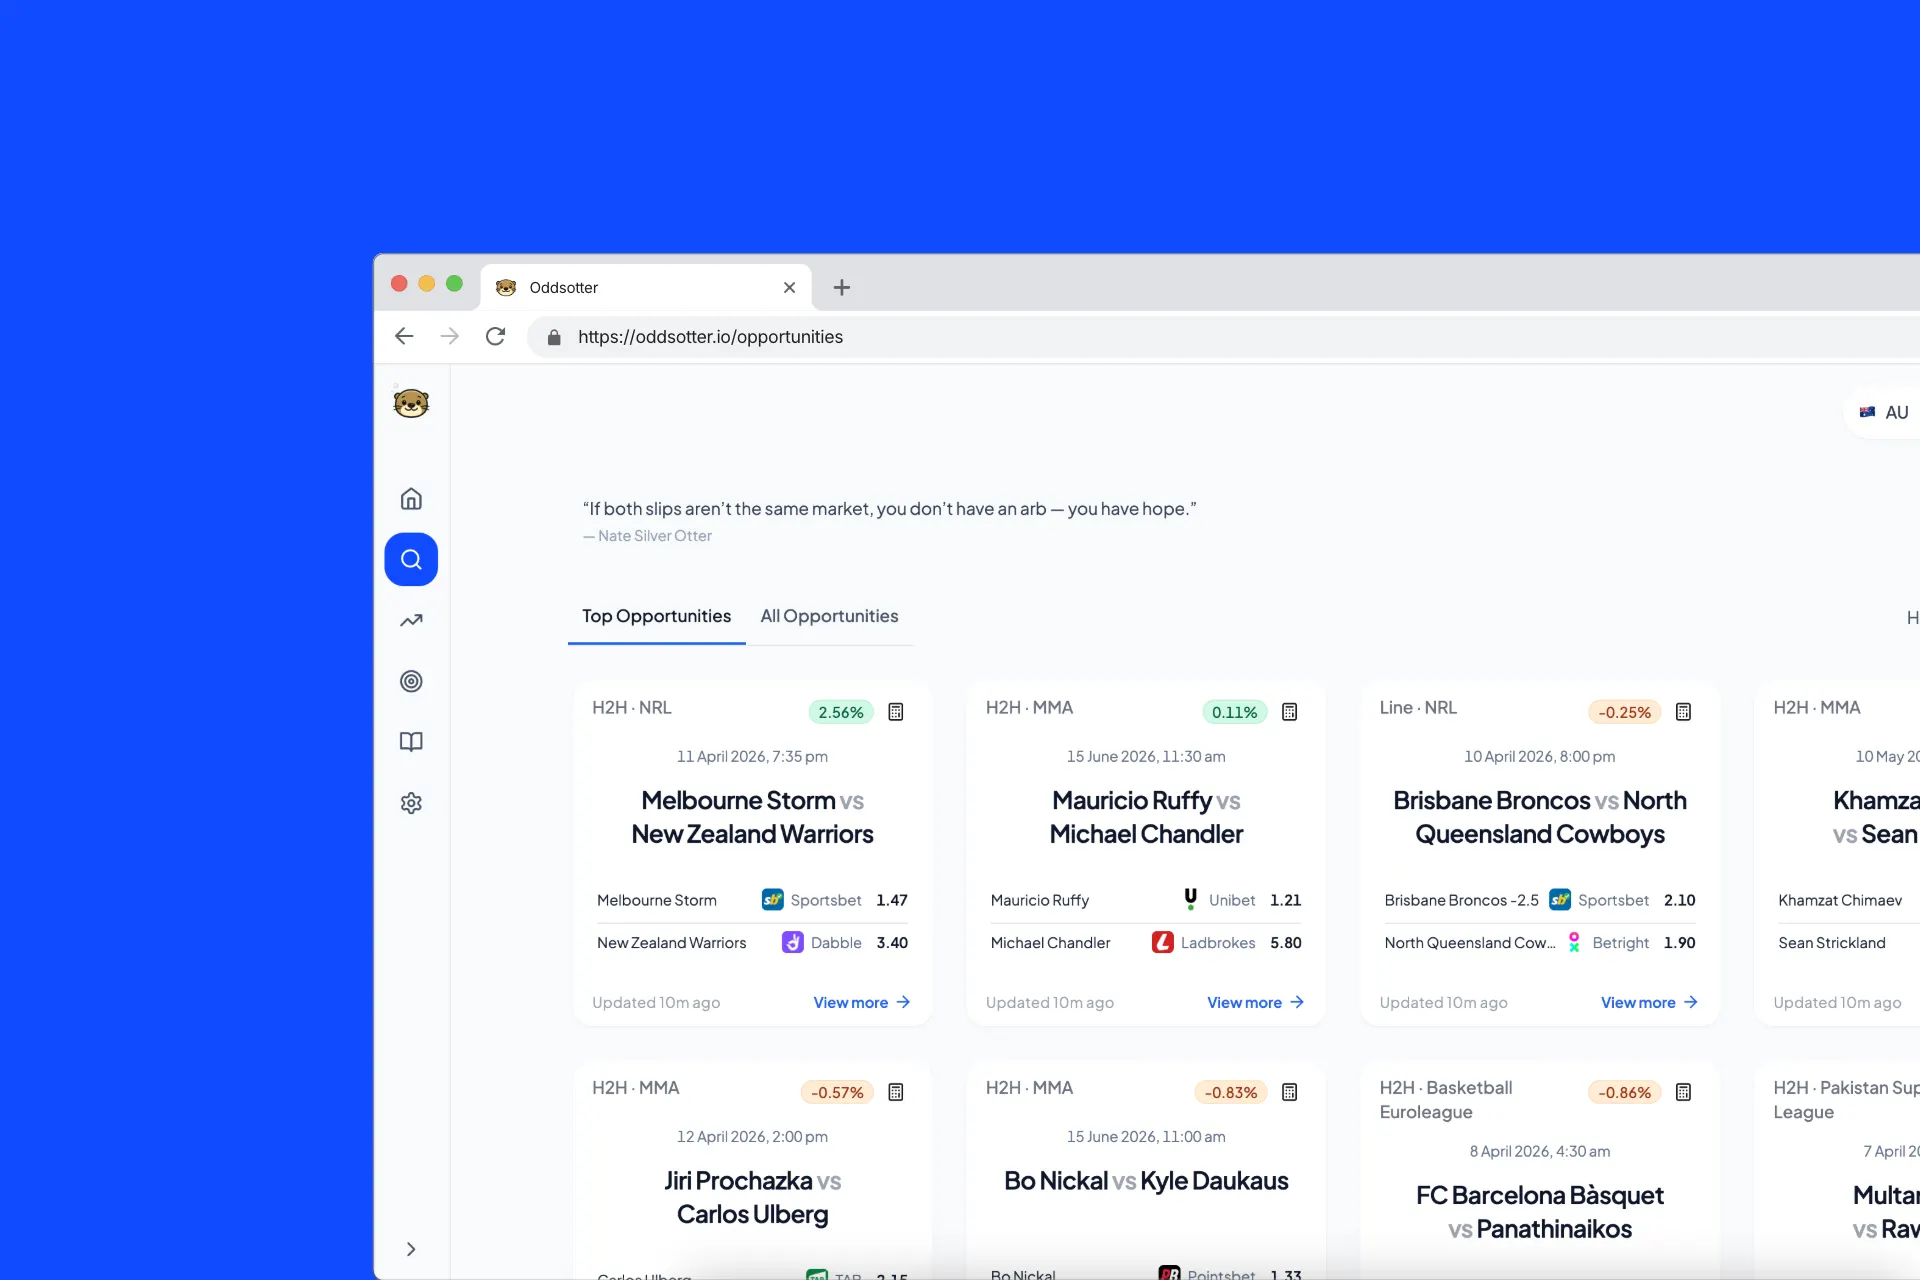
Better bookmaker coverage helps you compare odds and find stronger prices.

A single bookmaker shows only one view of the market. OddsOtter compares recent prices across bookmakers to build a best-available market view. This matters because the strongest price is not always with the same operator: one bookmaker may lead on the home team, another on the draw, and another on the away team.

By combining the best available price on each outcome, OddsOtter can reveal a materially tighter market than any single bookmaker's standalone price set. The example below shows a live OddsOtter snapshot from 24 April 2026, using UK-region prices for Macarthur FC vs Wellington Phoenix FC.

How bookmaker coverage affects market margin

Table 1: Best-available odds can reduce observed market margin

BookmakerMacarthurDrawWellingtonMarket Margin
Paddy Power2.104.003.005.95%
Betfred2.053.753.008.78%
888sport2.053.802.909.58%
Unibet2.103.902.907.74%
Ladbrokes2.153.803.006.16%
Coral2.153.803.006.16%
LeoVegas2.063.703.256.34%
Best available2.154.003.252.28%

No single bookmaker offered the strongest price on every outcome. But by taking the best available price across books, the observed margin fell to 2.28%.

That is the practical value of cross-book comparison. Most bettors only see one bookmaker's price set. Without comparing the wider market, they may accept a higher built-in margin without knowing better prices are available elsewhere. OddsOtter makes that comparison visible, and the same pattern appears across a broader 24 April 2026 snapshot of 114,136 fresh odds rows across 4,038 complete markets and 769 events.

Table 2: More bookmaker coverage reduces observed market margin

CoverageEventsMarketsAverage market %Average marginArbitrage %
1 bookmaker5471,174106.03%6.03%0.00%
2-3 bookmakers448806104.40%4.40%0.37%
4-9 bookmakers550826103.76%3.76%1.33%
10-14 bookmakers221243103.69%3.69%2.47%
15-24 bookmakers390430102.15%2.15%5.81%
25+ bookmakers523559101.10%1.10%16.46%

In this snapshot, markets with one available bookmaker had an average margin of 6.03%. Markets with 25 or more bookmakers had an average margin of 1.10%, and 16.46% of complete markets were observed below 100%, meaning an arbitrage opportunity was indicated if each required bookmaker price could be backed. You can check stake splits with the arbitrage calculator.

Lower overround does not guarantee profit, but it creates a better starting point. It reduces the built-in edge in the market and makes pricing inefficiencies easier to identify. For OddsOtter, broader bookmaker coverage is not just a feature. It is the foundation behind arbitrage detection, positive EV signals, and more reliable market comparison.

Please note: this analysis is based on a live OddsOtter snapshot from 24 April 2026. It only includes selected betting types and complete markets available at the time of capture. The data also compares bookmakers across regions, so availability, liquidity, and market timing may vary by operator and location. Odds were filtered for recent updates, but a 10-minute freshness window can still include stale or fast-moving lines.

The snapshot was concentrated in the following sports and market types:

Sports by event

Soccer64.0%
MMA10.4%
Tennis7.3%
Boxing6.8%
Basketball2.9%
Baseball2.9%
Other5.9%

Market types by market

Spreads44.0%
Totals34.9%
Head-to-head (3-way)14.6%
Head-to-head (2-way)6.5%

The point is directional, not absolute: across this snapshot, wider bookmaker coverage was associated with materially lower observed margin.